
Decoding Bitcoin Correlations with AI: Leveraging Plugins for In-depth Financial Market Analysis
A Comprehensive Analysis Using PortfoliosLab, StockData, and Noteable Plugins

In this edition of our newsletter, we delve into the intricate dynamics of financial market correlations, with a spotlight on Bitcoin (BTC-USD). To conduct this comprehensive analysis, we've leveraged the capabilities of three powerful tools: PortfoliosLab, StockData, and Noteable.
Plugins:
PortfoliosLab, a state-of-the-art tool, allows us to retrieve detailed information about various assets, calculate risk metrics, and analyze historical performance. StockData, on the other hand, provides real-time data for stocks, offering a wealth of information including price data, performance data, fundamental data, statistical data, and risk data for individual stocks.
In addition, we've utilized Noteable, an advanced data science platform that enables us to create, run, and share Python notebooks. With Noteable, we've been able to perform complex calculations, generate insightful visualizations, and document our analysis in a clear and reproducible format.
Here are some key points about the data and methodology used in our analysis:
The data used to generate the correlation graph is actual historical price data for Bitcoin (BTC-USD), Ethereum (ETH-USD), S&P 500 (^GSPC), NASDAQ 100 (^NDX), and Gold (GC=F) over the past year.
The data was fetched using the yfinance library, which downloads historical market data from Yahoo Finance, a reliable source of financial data.
The correlations were then calculated based on the daily returns of these assets, and a rolling 30-day correlation was computed to show how the correlation changes over time.
By integrating these tools into our systems, we've been able to fetch real-time data, calculate complex metrics, and generate insightful visualizations with unprecedented ease and efficiency. The power of these tools lies in their ability to process vast amounts of data, their versatility in handling different types of financial data, and their adaptability to various analytical tasks.
We share the results of our analysis, shedding light on the evolving relationships between Bitcoin, Ethereum, S&P 500, NASDAQ 100, and Gold. We hope you find these insights valuable in navigating the complex landscape of today's financial markets.
1.
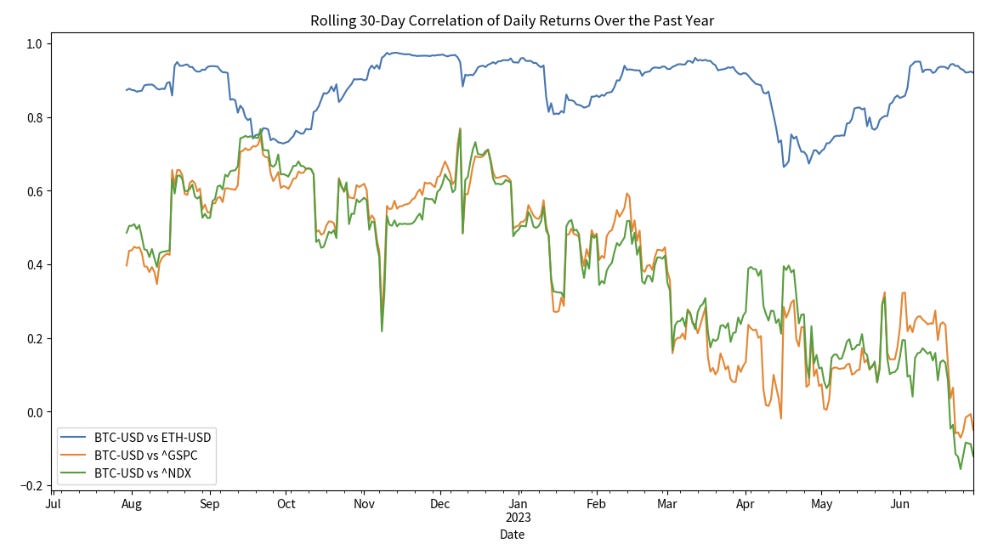
Rolling 30-Day Correlation of Daily Returns: The first graph presents the rolling 30-day correlation of daily returns between Bitcoin (BTC-USD) and each of the other assets (Ethereum (ETH-USD), S&P 500 (^GSPC), and NASDAQ 100 (^NDX)) over the past year. The correlation between Bitcoin and Ethereum is mostly positive and quite high, often above 0.5, indicating that the daily returns of Bitcoin and Ethereum often move in the same direction. However, the correlation is not constant and fluctuates over time, sometimes dropping near 0 or even going slightly negative. This suggests that there are periods when the relationship between Bitcoin and Ethereum weakens or even reverses.
Moving on to Bitcoin's correlation with the S&P 500 and NASDAQ 100, it is also mostly positive but generally lower than the correlation between Bitcoin and Ethereum. This indicates that the daily returns of Bitcoin and these indices also tend to move in the same direction, but not as strongly or consistently as Bitcoin and Ethereum. The correlation fluctuates over time and sometimes goes negative, suggesting that there are periods when Bitcoin and these indices move in opposite directions. However, we are seeing a bigger independence for BTC as we see a decline in the correlation of the big indices in the US. This is a major move of BTC becoming widely accepted as its own security.
2.
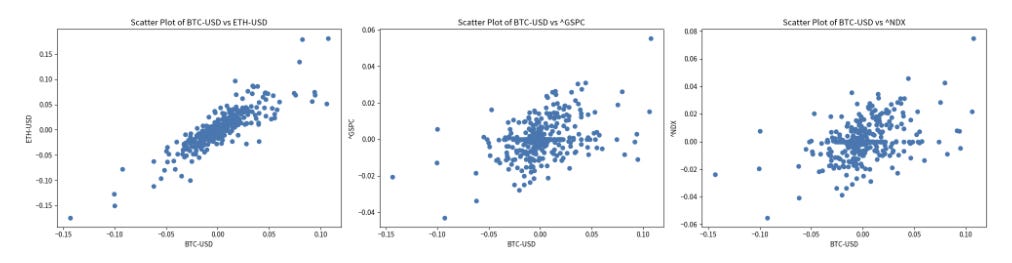
Scatter Plots of Daily Returns: Transitioning from the correlation graphs, we look at scatter plots that show the relationship between the daily returns of Bitcoin (BTC-USD) and each of the other assets. For Bitcoin and Ethereum, the points are quite closely clustered along a line, indicating a strong positive correlation. This suggests that when Bitcoin's daily return increases, Ethereum's daily return also tends to increase, and vice versa. In contrast, the points are more spread out for Bitcoin and the indices, indicating a weaker correlation. This suggests that the daily returns of Bitcoin and these indices do not move as closely together.
3.
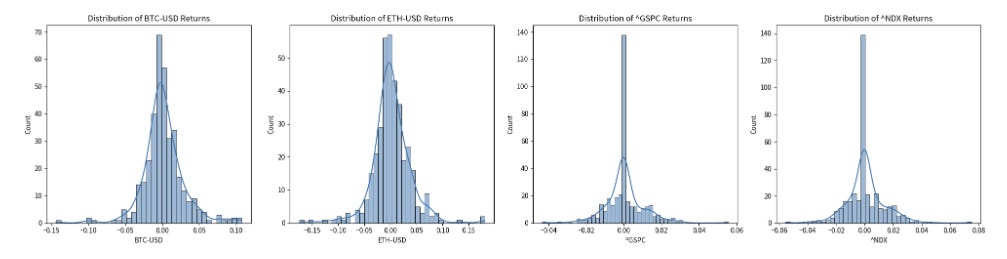
Histograms or Density Plots of Daily Returns: Next, we examine the distribution of daily returns for each asset. The distributions for Bitcoin and Ethereum are wider and have fatter tails compared to the distributions for the S&P 500 and NASDAQ 100. This indicates higher volatility and a higher likelihood of extreme returns (both positive and negative) for BTC and ETH. On the other hand, the distributions for the S&P 500 and NASDAQ 100 are narrower and more peaked, indicating lower volatility and a lower likelihood of extreme returns.
4.
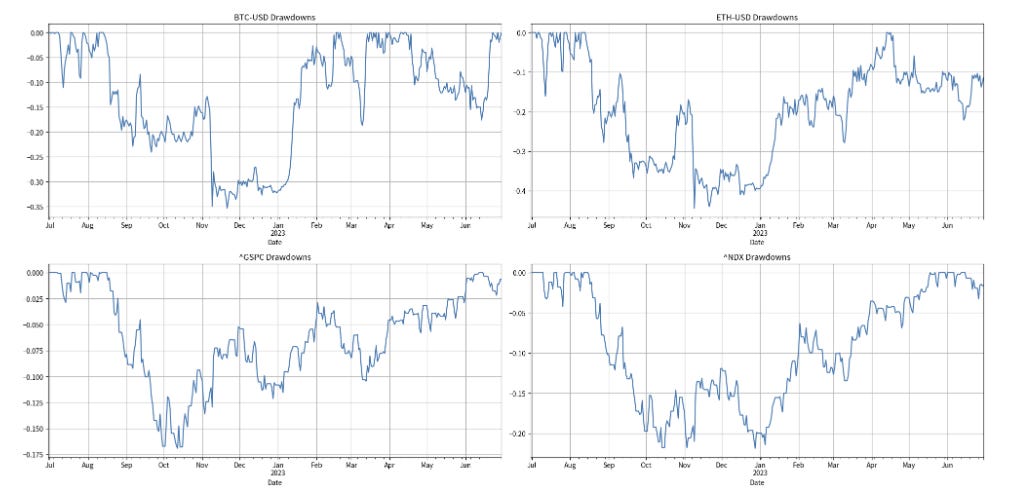
Drawdowns: Lastly, we look at the drawdowns for each asset over the past year. A drawdown is a peak-to-trough decline during a specific period of an investment. The drawdowns for Bitcoin and Ethereum are deeper and more frequent compared to the drawdowns for the S&P 500 and NASDAQ 100. This indicates higher downside risk for these cryptocurrencies. Conversely, the drawdowns for the S&P 500 and NASDAQ 100 are shallower and less frequent, indicating lower downside risk for these indices.
5.
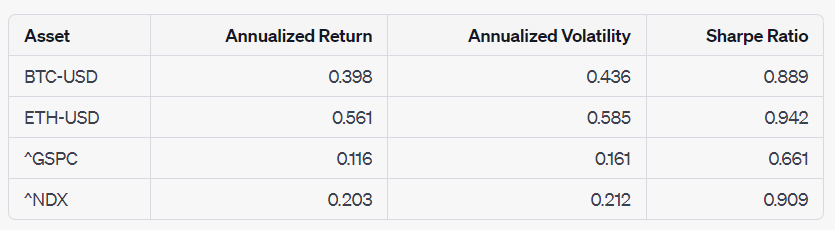
Risk/Return Metrics: As we move forward from the drawdowns, we delve into some key risk/return metrics for each asset, namely Annualized Return, Annualized Volatility, and Sharpe Ratio.
Annualized Return: This is the average return over one year. Ethereum emerges as the asset with the highest annualized return, followed by Bitcoin, NASDAQ 100, and S&P 500. This order of returns highlights the potential for high rewards in the cryptocurrency space, albeit with higher risk.
Annualized Volatility: This is a measure of risk and represents the standard deviation of the asset's returns over one year. Consistent with the potential for high returns, Ethereum also exhibits the highest annualized volatility, indicating the highest level of risk. Bitcoin follows, with NASDAQ 100 and S&P 500 trailing, reflecting the generally lower risk levels associated with established stock indices.
Sharpe Ratio: This is a measure of risk-adjusted return. It's calculated as the difference between the asset's annualized return and a risk-free rate (assumed to be 1% in this case), divided by the asset's annualized volatility. A higher Sharpe ratio indicates a better risk-adjusted return. Interestingly, despite its high volatility, Ethereum has the highest Sharpe ratio, indicating that its high returns have been sufficient to offset its high risk. NASDAQ 100 follows closely, then Bitcoin, and S&P 500.
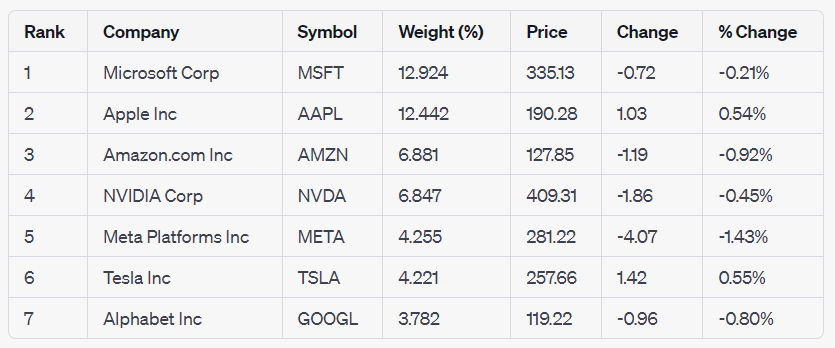
The NASDAQ 100's high Sharpe ratio is particularly noteworthy. As of June 9th, seven companies, often referred to as the "Magnificent Seven," have significantly contributed to the NASDAQ 100's performance. These companies are Microsoft (MSFT), Apple (AAPL), Amazon (AMZN), NVIDIA (NVDA), Meta Platforms (META, formerly Facebook), Tesla (TSLA), and Alphabet (GOOGL). Collectively, these companies returned 53% year-to-date (YTD), significantly contributing to the NASDAQ 100's overall gain of 37.5%.
The high returns and substantial weights of these companies in the index have played a crucial role in the index's performance, contributing to its high Sharpe ratio. However, the high concentration of a few companies in the NASDAQ 100 index can increase the index's volatility and risk. If one or more of these companies underperform, it could significantly impact the index's overall performance.
The analysis of Bitcoin's (BTC-USD) correlation with traditional financial markets, specifically the S&P 500 (^GSPC) and NASDAQ 100 (^NDX), reveals a complex and evolving relationship. While Bitcoin has shown a positive correlation with these indices over the past year, the strength of this correlation has varied over time, reflecting changes in market conditions, investor sentiment, and global economic events.
Recently, there has been a significant development in the traditional finance (TradFi) sector that could potentially impact Bitcoin's correlation with the broader stock market. Several prominent financial institutions have filed for a Bitcoin Exchange Traded Fund (ETF), including Blackrock, Fidelity, and Invesco.
The filing for a Bitcoin ETF by these institutions is a significant step towards the integration of Bitcoin into the traditional financial system. It indicates a growing acceptance of Bitcoin as a legitimate asset class by mainstream financial institutions.
This development could potentially influence Bitcoin's correlation with the broader stock market in several ways:
Increased Integration: As Bitcoin becomes more integrated with the traditional financial system, its price movements could become more aligned with those of traditional assets, potentially increasing its correlation with the broader stock market.
Diversification: On the other hand, as more investors view Bitcoin as a separate asset class, they may use it as a diversification tool in their portfolios. This could lead to Bitcoin's price movements becoming more independent of traditional assets, potentially decreasing its correlation with the broader stock market.
Market Sentiment: The approval of a Bitcoin ETF could significantly impact market sentiment towards Bitcoin, leading to increased volatility and potentially unpredictable effects on its correlation with the broader stock market.
And yes, we did put the so-called "digital gold" to the test against actual gold. However, the correlation between Bitcoin (BTC-USD) and Gold (GC=F) turned out to be even weaker than that between Bitcoin and the other assets, with a correlation coefficient of approximately 0.25. This suggests that the daily price movements of Bitcoin and Gold have not consistently mirrored each other over the past year, underscoring the complex dynamics at play in the financial markets.
In conclusion, while the filing for a Bitcoin ETF by major financial institutions is a significant development, its impact on Bitcoin's correlation with the broader stock market is uncertain and will likely depend on a variety of factors, including regulatory decisions, market sentiment, and the behavior of investors.
It's important to note that all the data used in this analysis was fetched using the powerful AI plugins PortfoliosLab and StockData, and all graphs and plots were generated using the advanced data science platform, Noteable. These tools have enabled us to conduct a comprehensive and in-depth analysis, demonstrating the power of AI in financial market analysis.
As always, investors should consider their risk tolerance and investment goals when investing in Bitcoin and other cryptocurrencies. The insights provided in this analysis, powered by cutting-edge AI tools, aim to assist in making informed investment decisions.